Like most websites, we use cookies to make our site work the way you expect it to, improve your experience on our site, analyze site usage, and assist in our marketing efforts. By choosing "Accept All Cookies", you agree to the storing of all categories of cookies on your device.
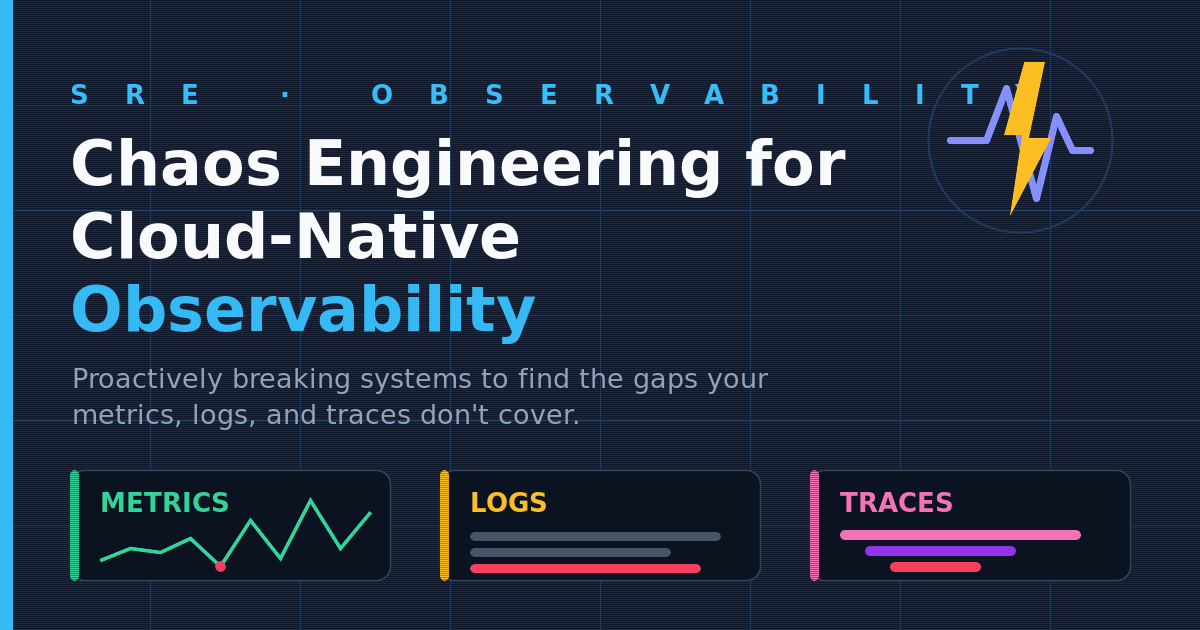
Here is an uncomfortable truth about observability: you only find out your dashboards are wrong, your alerts are silent, and your traces are broken during an incident. The one moment you most need visibility is the moment you discover you never had it.
Chaos engineering flips that script. Instead of waiting for production to break and hoping your telemetry holds up, you deliberately inject controlled failures and verify that your metrics, logs, and traces actually captured what happened.
Introduction In distributed systems, cascading failures are one of the most devastating failure modes. When a downstream service becomes slow or unresponsive, upstream services can exhaust their resources waiting for responses, causing a domino effect that brings down entire systems. The 2017 AWS S3 outage, which cascaded across multiple services and lasted nearly four hours, demonstrated how a single service failure can ripple through interconnected systems.
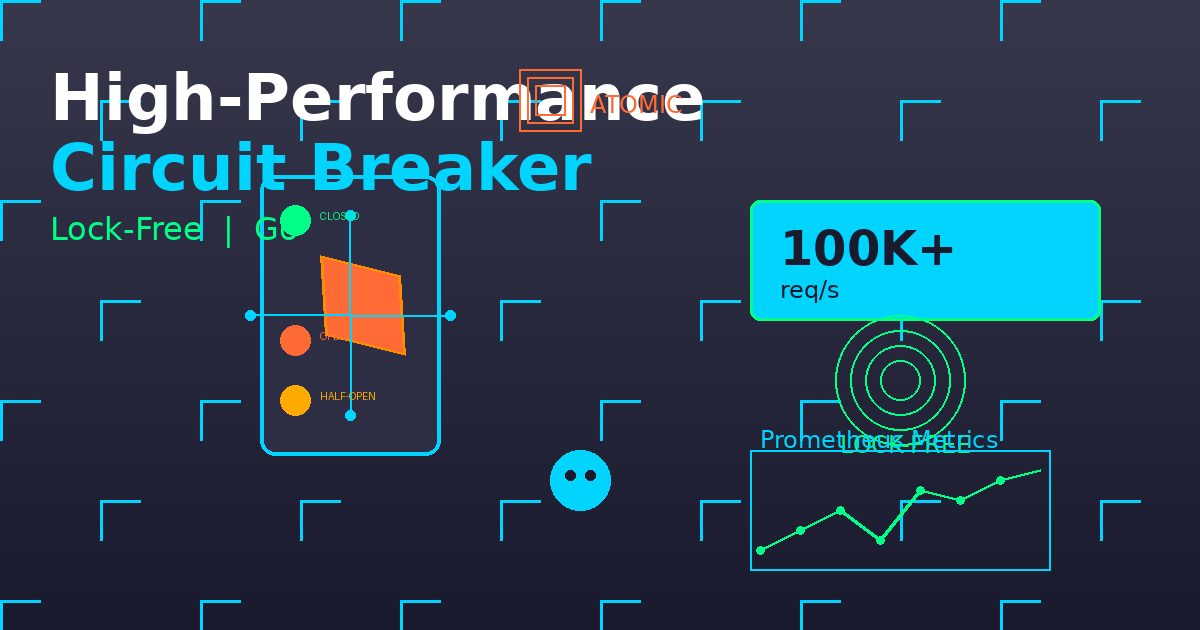
Circuit breakers act as automatic safety switches that prevent cascading failures by detecting when a service is unhealthy and temporarily blocking requests to it.
Hassle-Free Prometheus on Bare Metal Monitoring bare metal infrastructure with Prometheus is notoriously challenging. Unlike cloud environments with built-in service discovery, bare metal deployments require manual configuration of scrape targets. Every time you add a server, you must update Prometheus configs, manage TLS certificates, and ensure exporters are accessible. This manual process is error-prone, time-consuming, and doesn’t scale.
In this guide, we’ll build a production-ready service discovery system specifically designed for bare metal Prometheus deployments.